

Part A: Strategies to encourage consumption – Electric vehicles (EVs)
Source 1: Reasons for promoting the consumption of EVs
Vehicles play an important role in terms of contribution to total emissions. As of 2021, almost one fifth of Australia’s carbon emissions came from transportation-related activities… When used in combination with renewable energy, EVs are critical in helping reduce Australia’s carbon footprint.
Source: KPMG. Accelerating Australian electric vehicle uptake where it matters. 11 October, 2022. In-text reference: (KPMG, 2022)
Source 2: Reasons for low uptake of EVs by businesses
… CommBank research reveals that … more than a third (38%) of businesses said a lower purchase price would encourage them to transition to EVs right now, while 51% said it would motivate them to evaluate a transition over the next 24 months. Other factors that would accelerate a switch to EVs include more public charging infrastructure (30%) and government rebates (28%).
Source: CommBank. “Why businesses are looking towards an electric vehicle future”. In-text reference: (CommBank, nd)
Source 3: Recent Australian Government Initiatives
The Electric Car Discount Bill was passed through the Australian Parliament in November 2022. It provides:
- Up to $2,000 off the purchased price of electric vehicles.
- Fridge benefit tax (FBT) exemptions for business ($9,000 per year for an employer for a car purchased for $50,000). This will apply to cars purchased on or after July 1, 2022.
Other taxes and initiatives
- Five percent important tariff for EVs priced under the LCT threshold has been cut (saving of about $2,500). These incentives mean that a car purchased for $50,000 in December 2021 will now cost $45,500. Businesses will also save $9,000 per year in tax (FBT).
Funding:
- Rollout of 400 public fast-charging stations with the private sector
- 117 EV charging stations and hydrogen refuelling stations for key freight routes.
- Rolling out EV charging networks to fill blackspots in regional and remote Australia, with a fast charging station spread at least every 150 kilometres apart.
Source: Fisk, K., Man, H. “What electric car incentives are on offer in Australia?” WHICHCAR?, 4 July 2023. In-text reference: (Fisk et al, 2023)
Source 4: EV sales in Australia in 2023
Battery electric vehicles accounted for a record 7.4 per cent of total new vehicle sales in Australia over the first half of 2023, with a tick over 43,000 EVs delivered into customer hands. At this point last year the EV market share was just 1.8 per cent – meaning a four-fold increase in share over just 12 months.
Costello, M. “Australia’s 2023 electric car sales by make, model and region”. CarExpert, 6 July 2023. In-text reference: (Costello, 2023)
Source 5: Uptake of EVs in Australia, 2022
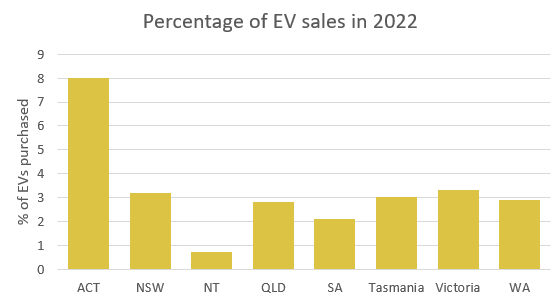
Source: Thompson, C., “Which states buy the most electric cars? EV sales in Australia broken down by state for 2022”, carsguide, 2 May, 2023. In-text reference: (Thompson, 2023)
Source 6: Strategies to increase the uptake of EVs in ACT
ACT has some of the most generous incentives in the country for electric vehicles. These include:
- Two years free registration for newly purchased new and used Zero Emission Vehicles (ZEV) from 24 May 2021 until 30 June 2024.
- Stamp duty exemption on ZEVs being purchased for the first time.
- Interest-free loans from $2000 up to $15,000 for the purchase of ZEVs, repayable over up to 10 years.
- ZEVs access to transit lanes.
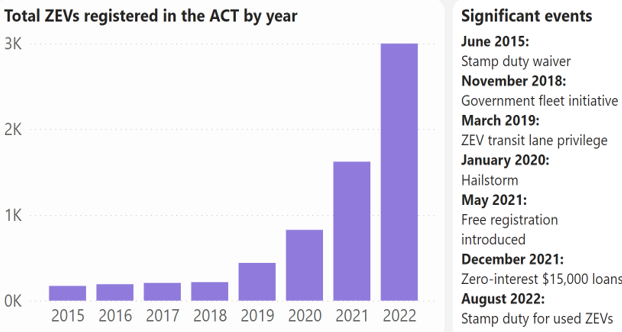
NRMA, “ACT electric vehicle subsidies and incentives”. In-text reference: (NRMA, nd)
Part B: Strategies to discourage consumption
Source 7: Health taxes
Health taxes [also known as ‘sin taxes’] are levied on products that have a negative public health impact, for example tobacco, alcohol and sugar-sweetened beverages (SSBs). These taxes are considered win-win-win policies because they save lives and prevent disease while advancing health equity and mobilising revenue for the general budget.
The aim of health tax policy is to reduce the consumption of products deemed risk factors for …diseases by making them less affordable through higher prices. This is achieved with regular tax increases large enough to result in real price increases …
Source: World Health Organization. ”Health taxes”. 2023. In-text reference: (WHO, 2023)
Source 8: Why excise taxes?
When you introduce a tax on something, you send a signal to people that the product is unhealthy.
You also create a disincentive to buying it, by raising the price.
As a bonus, a tax raises money which can be spent on preventative health programs.
Australian Medical Association. “How a tax on sugary drinks is part of the solution”. 2023. In-text reference: (AMA, 2023)
Source 9: What is wrong with excise taxes?
A feature of any consumption tax with a flat rate is that lower income taxpayers pay more tax than their respective ability to pay (e.g., as a portion of income). Indeed, as lower income households spend a greater portion of their income on consumption (compared to richer persons who save or invest more), they in fact suffer a greater comparative burden from taxes on consumption. This impact is often exacerbated by the nature of the goods targeted by specific taxes (such as cigarettes, alcohol, and sugary drinks) often making up a larger part of the spending of many lower-income households.
Source: Parkes, M. ‘A role for taxation in reducing Australia’s sugar consumption’. TPI – Policy Brief 1/2022, Melbourne: March 2022. In-text reference: (Parkes, 2022)
Choose either Part C or D.
Part C: Tax on sugar
Source 10: Impact of a tax on SSBs in Berkley
In November 2014, the city of Berkeley became the first US jurisdiction to implement a tax on of sugar-sweetened beverages (SSBs).
The tax of one cent (per fluid ounce) meant that a $1 can of soft drink (12 oz / 355 mL) increased in price to $1.12 ($1.18 in Australian currency).
Three years later, residents reported drinking 52% fewer servings of sugary drinks than they did before the tax was passed. Water consumption also saw a bump, going up 29% over the three-year period.
Source: University of California - Berkeley. "Three years into soda tax, sugary drink consumption down more than 50 percent in Berkeley”. ScienceDaily, 21 February 2019. In-text reference: (University of California, 2019)
Source 11: Why should Australia introduce a tax on SSBs?
Reduced sugar consumption and improved diet would likely lead to a reduction in obesity and chronic diseases, and result in substantial healthcare savings.
Previous Australian modelling estimated that a tax that increases the retail price by 20 per cent would lead to a reduction in the prevalence of obesity of around 2 per cent and healthcare expenditure savings of $609 million to $1.73 billion.
It also estimated that the tax could, over a 25-year period, result in 16,000 fewer cases of type 2 diabetes, 4,400 fewer cases of heart disease and 1,100 fewer cases of stroke.
Australian Medical Association. “How a tax on sugary drinks is part of the solution”. 2023. In-text reference: (AMA, 2023)
Source 12 Impact of SSB tax on business decisions – Case study of the UK
An SSB tax, called the Soft Drinks Industry Levy, was introduced in the United Kingdom in April 2018. The UK did not impose the SSB tax on drinks containing less than 5 grams per mL. One year after introduction of the tax, the total volume of purchased soft drinks, including those that are not subject to the new tax, has remained unchanged. However, because of the ways businesses responded, there was a 35.4% reduction in consumed sugar from taxed drinks.
How did manufacturers respond?
Manufacturers responded to the UK tax by widespread reformulation of their products to reduce sugar levels to less than 5 g sugar/100mL. The reduction in sugar from this reformulation was the equivalent of removing a total of 45 million kg of sugar from soft drinks each year.
There was a 43.7% reduction in the sugar content in the drinks subject to the tax by four years after the tax was introduced.
How did retailers respond?
The proportion of drinks available in supermarkets with high sugar content dropped after the new tax. Between 2015 and 2019, the percentage of drinks in supermarkets with sugar content of more than 5 g per 100 mL fell from 49% to 15%.
Source: Obesity Evidence Hub. “Countries that have taxes on sugar-sweetened beverages (SSBs)”. Cancer Council Victoria, Melbourne, 2022. In-text reference: (Obesity Evidence Hub, 2022)
Part D: Tobacco
Source 13: Cost of smoking on individuals
Smoking-related diseases killed almost 21,000 Australians in 2015. That's more than 50 preventable deaths every day. Smoking is the leading cause of preventable death and illness in Australia.
Cancer was the number one cause of tobacco-related death and illness and was responsible for 43% of the healthy years lost due to smoking. Lung cancer currently causes the most cancer deaths in Australia and this is due mainly to smoking.
The major tobacco-related diseases include cancer, heart disease and chronic obstructive pulmonary disease (lung disease).
Source: Health Channel. “Smoking statistics”. Melbourne: 13 July 2021. In-text reference: (Health Channel, 2021)
Source 14: Costs of smoking to government and society
Tangible costs of smoking identified in the report include $5 billion in lost productivity and worker absences, $2 billion for family members caring for someone with a smoking-related disease and $6.8 billion in health care costs, including the cost of 1.7 million hospital admissions to treat smoking-related conditions.
Intangible costs, such as the years of life lost from premature deaths in that year or lost quality of life from living with a serious illness, were estimated at a massive $117.7 billion per year.
Cancer Council. “New report highlights the $137 billion cost of smoking.” 22 October 2019. In-text reference: (Cancer Council, 2023)
Source 15: Prevalence of regular smokers in Australia aged 18+ years, 1995–2023 (%)
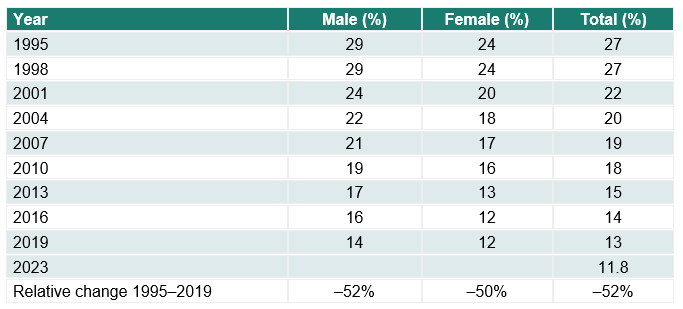
The downturn in smoking prevalence seen by the early 2000s may be attributable to the combined effects of increased tobacco taxes, additional smoke-free legislation, and the National Tobacco Campaign, a mass-media-led program aimed at encouraging cessation, which was launched in June 1997 and ran over several subsequent years.
Source: Greenhalgh, EM, Scollo, MM and Winstanley, MH. “Tobacco in Australia: Facts and issues”. Melbourne: Cancer Council Victoria; 2023. In-text reference: (Greenhalgh et al, 2023)
Source 16: Excise tax on tobacco – 1995-2023 ($)
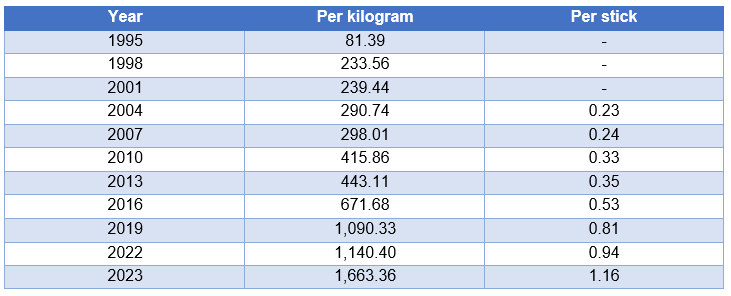
Source: ATO, “Historical excise data”. In-text reference: (ATO, nd)
Source 17: Effect of tobacco excise tax on business decisions – Case study of Tasmania
There is little a business can do to offset the excise tax on tobacco except pass on the cost to the consumer. But because they pay the excise tax to the manufacturer and customers expect them to stock a comprehensive range of tobacco brands, they often have a lot of money invested in their stock. This, and other factors are causing some businesses to reconsider selling tobacco products. The most common reason for deciding to no longer sell tobacco is the lack of profitability of tobacco sales.
The reasons underpinning low profitability are those that increase the costs of selling tobacco [such as licencing fees and excise tax]against those that reduce tobacco sales and revenue [such as quit campaigns, plain packaging and excise tax].
Source: Melody, S. “Why Retailers Stop Selling Tobacco and Implications for Tobacco Control”. Public Health Services, Department of Health and Human Services Tasmania: 30 March 2017. In-text reference: (Melody, 2017)