

Investment returns
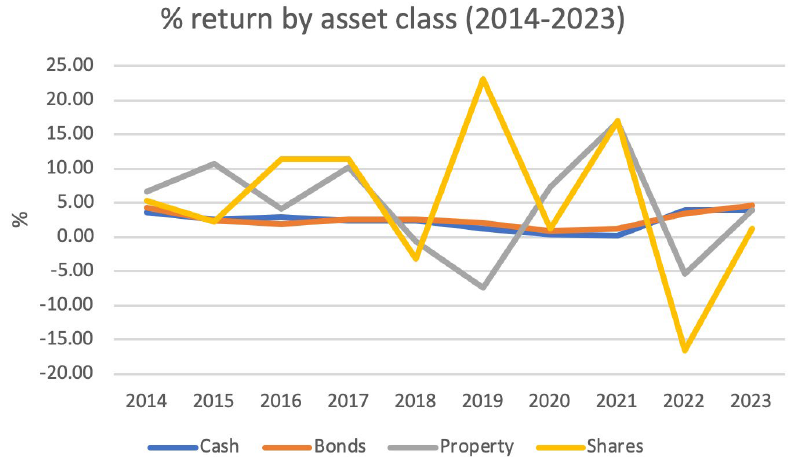
Figure 1: Percentage return by asset class – 2014-2023
The following tables represent the returns on an investment of $100,000 over different periods of time.
Table 1: One-year investment
| Date of investment | Gain or Loss (actual return on $100,000) | |||
| Year beginning and ending | Cash | Bonds | Property | Shares |
| 2014 | $3,600 | $4,308 | $6,700 | $5,310 |
| 2015 | $2,650 | $2,407 | $10,700 | $2,250 |
| 2016 | $2,950 | $1,933 | $4,100 | $11,450 |
| 2017 | $2,450 | $2,650 | $10,200 | $11,460 |
| 2018 | $2,350 | $2,600 | -$600 | -$3,100 |
| 2019 | $1,200 | $2,100 | -$7,400 | $23,020 |
| 2020 | $350 | $860 | $7,400 | $1,180 |
| 2021 | $300 | $1,200 | $16,800 | $16,970 |
| 2022 | $4,000 | $3,400 | -$5,300 | -$16,500 |
| 2023 | $4,000 | $4,600 | $3,900 | $1,300 |
Table 2: Two-year investment
| Date of investment | Gain or Loss (actual return on $100,000) | |||
| Year beginning and ending | Cash | Bonds | Property | Shares |
| 2014-15 | $6,250 | $6,715 | $17,400 | $7,560 |
| 2015-16 | $5,600 | $4,340 | $14,800 | $13,700 |
| 2016-17 | $5,400 | $4,583 | $14,300 | $22,910 |
| 2017-18 | $4,800 | $5,250 | $9,600 | $8,360 |
| 2018-19 | $3,550 | $4,700 | -$8,000 | $19,920 |
| 2019-20 | $1,550 | $2,960 | $0 | $24,200 |
| 2020-21 | $650 | $2,060 | $24,200 | $18,150 |
| 2021-22 | $4,300 | $4,600 | $11,500 | $470 |
| 2022-23 | $8,000 | $8,000 | -$1,400 | -$15,200 |
Table 3: Three-year investment
| Date of investment | Gain or Loss (actual return on $100,000) | |||
| Year beginning and ending | Cash | Bonds | Property | Shares |
| 2014-16 | $9,200 | $8,648 | $21,500 | $19,010 |
| 2015-17 | $8,050 | $6,990 | $25,000 | $25,160 |
| 2016-18 | $7,750 | $7,183 | $13,700 | $19,810 |
| 2017-19 | $6,000 | $7,350 | $2,200 | $31,380 |
| 2018-20 | $3,900 | $5,560 | -$600 | $21,100 |
| 2019-21 | $1,850 | $4,160 | $16,800 | $41,170 |
| 2020-22 | $4,650 | $5,460 | $18,900 | $1,650 |
| 2021-23 | $8,300 | $9,200 | $15,400 | 1,770 |
Table 4: Five-year investment
| Date of investment | Gain or Loss (actual return on $100,000) | |||
| Year beginning and ending | Cash | Bonds | Property | Shares |
| 2014-18 | $14,000 | $13,898 | $31,100 | $27,370 |
| 2015-19 | $11,600 | $11,690 | $17,000 | $27,370 |
| 2016-20 | $9,300 | $10,143 | $13,700 | $44,010 |
| 2017-21 | $6,650 | $9,410 | $26,400 | $49,530 |
| 2018-22 | $8,200 | $10,160 | $10,900 | $21,570 |
| 2019-23 | $9,850 | $12,160 | $15,400 | $25,970 |
Table 5: Ten-year investment
| Date of investment | Gain or Loss (actual return on $100,000) | |||
| Year beginning and ending | Cash | Bonds | Property | Shares |
| 2014-23 | $23,850 | $26,058 | $46,500 | $53,340 |
Sources:
https://www.rba.gov.au/statistics/tables/
https://www.marketindex.com.au/data-downloads
https://www.fool.com.au/2022/12/02/here-are-10-years-of-asx-200-historical-returns-3/
https://au.investing.com/rates-bonds/australia-10-year-bond-yield-historical-data