

Use this resource to complete the questions on the Poverty and the distribution of income in Australia – Data analysis worksheet.
Table 1: Income share of Australian households 2015–16
|
Income share |
% |
|---|---|
|
Lowest quintile |
7.7% |
|
Second quintile |
12.5% |
|
Third quintile |
17.0% |
|
Fourth quintile |
23.0% |
|
Highest quintile |
39.8% |
|
All households |
100.0% |
Source: Australian Bureau of Statistics, 6523.0 – Household Income and Wealth, Australia, 2015–16
Figure 1: Income Gini coefficient 1994–95 to 2015–16[1]
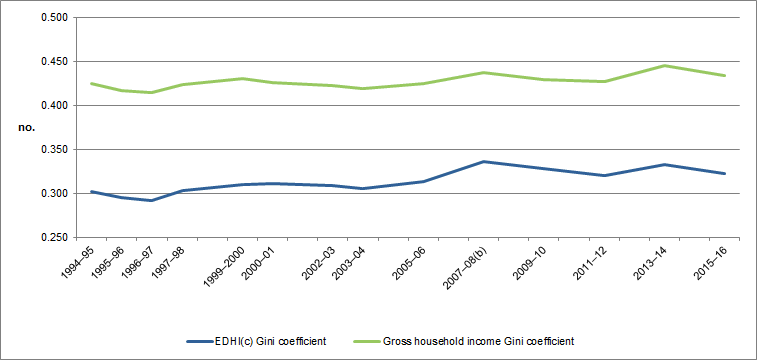
Source: ABS: 6523.0 - Household Income and Wealth, Australia, 2015–16
Table 2: Poverty Lines: Australia, March Quarter, 2018[2]
|
Income unit (Head in workforce) |
Including housing ($ per week) |
Other than housing ($ per week) |
|---|---|---|
|
Couple |
$693.78 |
$507.43 |
|
Couple plus 1 |
$833.96 |
$630.75 |
|
Couple plus 2 |
$974.14 |
$754.08 |
|
Couple plus 3 |
$1,114.32 |
$877.41 |
|
Couple plus 4 |
$1,254.50 |
$999.37 |
|
Single person |
$518.63 |
$349.03 |
|
Single person plus 1 |
$665.82 |
$479.37 |
|
Single person plus 2 |
$805.90 |
$602.70 |
| Single person plus 3; |
$946.08 |
$726.03 |
| &single person plus 4 |
$1,086.26 |
$849.35 |
Source: Melbourne Institute: Applied Economic & Social Research, Poverty Lines: Australia, March Quarter 2018
Table 3: Number of households by income range 2015–16
|
Equivalised disposable income per week |
Number of households |
Proportion of total number of households |
|---|---|---|
|
Negative income |
19,600 |
0.22 |
|
No income |
13,200 |
0.15 |
|
$1–99 |
92,400 |
1.03 |
|
$100–199 |
48,300 |
0.54 |
|
$200–299 |
87,800 |
0.98 |
|
$300–399 |
159,200 |
1.78 |
|
$400–499 |
598,900 |
6.68 |
|
$500–599 |
359,400 |
4.01 |
|
$600–699 |
401,600 |
4.48 |
|
$700–799 |
398,700 |
4.45 |
|
$800–899 |
341,400 |
3.81 |
|
Total |
2,520,500 |
28.1 |
Source: ABS: 6523.0 – Household Income and Wealth, Australia, 2015–16
Table 4: Comparison of Henderson Poverty Lines with the income of adults who receive maximum welfare payments and have no other income, March Quarter 2018
Part A: Married couple
|
Income unit |
Basic payment of person 1 |
Basic payment of person 2 (Partner) |
Family Tax Benefit Part A |
Family Tax Benefit Part B |
Rent Assistance |
Total Income |
Poverty Line |
|---|---|---|---|---|---|---|---|
|
Allowee |
$251.70 |
$251.70 |
0.00 |
0.00 |
$63.50 |
$566.90 |
$693.78 |
|
Pensioner |
$342.05 |
$342.05 |
0.00 |
0.00 |
$63.50 |
$747.60 |
$595.69 |
|
Couple plus 1 |
$251.70 |
$251.70 |
$93.17 |
$26.24 |
$79.17 |
$701.98 |
$833.96 |
|
Couple plus 2 |
$251.70 |
$251.70 |
$186.34 |
$26.24 |
$79.17 |
$795.15 |
$974.14 |
|
Couple plus 3 |
$251.70 |
$251.70 |
$279.51 |
$50.12 |
$89.39 |
$922.42 |
$1,114.32 |
|
Couple plus 4 |
$251.70 |
$251.70 |
$400.68 |
$50.12 |
$89.39 |
$1,043.59 |
$1,254.50 |
Part B: Single person
|
Income unit |
Basic payment of person 1 |
Basic payment of person 2 (Partner) |
Family Tax Benefit Part A |
Family Tax Benefit Part B |
Rent Assistance |
Total Income |
Poverty Line |
|---|---|---|---|---|---|---|---|
|
Allowee |
$277.30 |
- |
0.00 |
0.00 |
$67.40 |
$344.70 |
$518.63 |
|
Pensioner |
$453.80 |
- |
0.00 |
0.00 |
$67.40 |
$521.20 |
$420.54 |
|
Single person plus 1 |
$382.30 |
- |
$93.17 |
$55.30 |
$79.17 |
$609.94 |
$567.63 |
|
Single person plus 2 |
$382.30 |
- |
$186.34 |
$55.30 |
$79.17 |
$703.11 |
$707.81 |
|
Single person plus 3 |
$382.30 |
- |
$279.51 |
$79.17 |
$89.39 |
$830.37 |
$847.89 |
|
Single person plus 4 |
$382.30 |
- |
$400.68 |
$79.17 |
$89.39 |
$951.54 |
$988.17 |
Source: Melbourne Institute: Applied Economic & Social Research, Poverty Lines: Australia, March Quarter 2018
Table 5: Poverty lines by family type, 2015–16 ($ per week after tax, including social security payments)
|
Income unit |
50% of median income before housing costs |
60% of median income before housing costs |
50% of median income after housing costs |
60% of median income after housing costs |
|---|---|---|---|---|
|
Lone person |
$432.73 |
$519.28 |
$353.29 |
$423.94 |
|
Couple only |
$649.10 |
$778.92 |
$529.93 |
$635.91 |
|
Sole parent, 2 children |
$692.37 |
$830.85 |
$565.26 |
$678.31 |
|
Couple, 2 children |
$908.74 |
$1,090.48 |
$741.90 |
$890.28 |
Source: Davidson, P., Saunders, P., Bradbury, B. and Wong, M. (2018), Poverty in Australia, 2018. ACOSS/UNSW Poverty and Inequality Partnership Report No. 2, Sydney: ACOSS.
Table 6: Number and percentage of people below the 50% and 60% of median income poverty lines in 2015–16
|
|
50% of median poverty line |
60% of median poverty line |
|---|---|---|
|
Percentage of people below the poverty line |
13.2% |
21.1% |
|
Percentage of children below the poverty line |
17.3% |
25.5% |
|
Number of people below the poverty line |
3,051,500 |
4,885,200 |
|
Number of children below the poverty line |
739,300 |
1,087,500 |
|
Average poverty gap for those below the poverty line ($/week) |
$135.00 |
$206.00 |
|
Average poverty gap for those below the poverty line (% of poverty line) |
38% |
49% |
Source: Davidson, P., Saunders, P., Bradbury, B. and Wong, M. (2018), Poverty in Australia, 2018. ACOSS/UNSW Poverty and Inequality Partnership Report No. 2, Sydney: ACOSS.
Table 7: Rates of poverty - percentages of people from different groups living below poverty lines in 2015–16 (%)
Part A: All people
|
|
50% of median |
60% of median |
|---|---|---|
|
All people |
13.2% |
21.1% |
Part B: By age
|
|
50% of median |
60% of median |
|---|---|---|
|
Under 15 years |
17.3% |
25.5% |
|
15-24 years |
13.9% |
20.2% |
|
25-64 years |
12.1% |
17.6% |
|
65 years and over |
11.6% |
28.3% |
|
65 years and over, renting |
43.4% |
57.9% |
Part C: Children
|
|
50% of median |
60% of median |
|---|---|---|
|
Children in sole parent households |
39.4% |
52.3% |
|
Children in couple households |
13.1% |
20.1% |
|
Children in other households |
10.0% |
21.0% |
|
All children |
17.3% |
25.5% |
Part D: Family type
|
|
50% of median |
60% of median |
|---|---|---|
|
Single, no children (15-64 years) |
26.2% |
34.9% |
|
Couple, no children (15-64 years) |
18.0% |
46.5% |
|
Sole Parent |
32.0% |
43.2% |
|
Single, no children (64 years and over) |
9.6% |
13.2% |
|
Couple, no children (64 years and over) |
11.1% |
26.1% |
|
Couple, children |
11.9% |
18.3% |
|
Other |
7.1% |
11.6% |
Part E: By income source
|
|
50% of median |
60% of median |
|---|---|---|
|
Wage and salary |
6.9% |
11.5% |
|
Social security payment |
34.5% |
56.4% |
|
Other income |
14.9% |
17.5% |
|
By social security payment type |
50% of median |
60% of median |
|
Newstart allowance |
54.6% |
66.5% |
|
Youth allowance |
63.7% |
70.4% |
|
Parenting payment |
52.3% |
67.6% |
|
Disability support pension |
36.4% |
56% |
|
Carer payment |
17.1% |
42.1% |
|
Age pension |
12.2% |
31.5% |
|
All recipients |
25.6% |
44.1% |
Source: Davidson, P., Saunders, P., Bradbury, B. and Wong, M. (2018), Poverty in Australia, 2018. ACOSS/UNSW Poverty and Inequality Partnership Report No. 2, Sydney: ACOSS.
[1] The top line in figure 1 shows the Gini coefficient for gross household income (income before tax) and the bottom line shows the net household income (income after tax).
[2] All figures refer to income after tax.
Linked activity: